VinOx

VinOx Terminal

Subgen group, reports, SOTP and indicative live data.

Contact: info@vinoxdata.se
-- SEK Initializing Checking market status
VinOx Terminal

The Subgen AI group — reports, subsidiaries, SOTP stress test and live data.

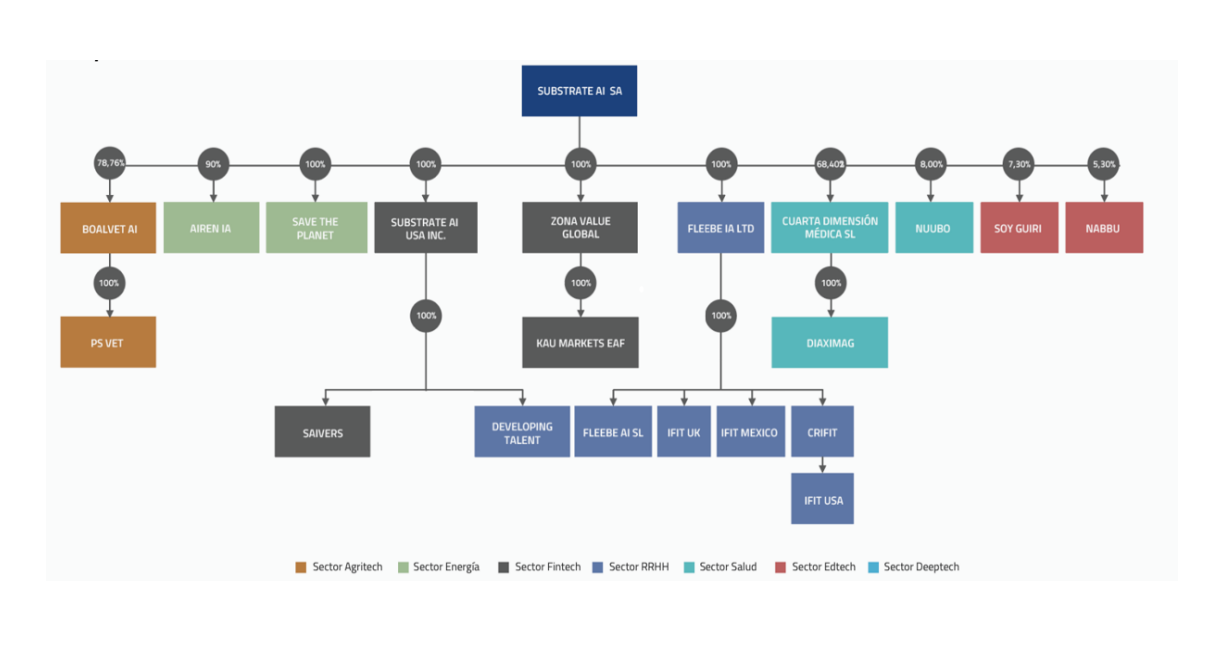
Vinoxdata brings Q1 2026, the 2025 annual report, the financial-targets correction, group structure, subsidiaries and an interactive valuation model into one terminal. Reported data, corrected information, model assumptions and indicative live market data are kept separate.

Reported: Q1 2026 / FY2025 Corrected: financial targets Model: SOTP stress test Indicative: live price / WAP / volume
Last trade iLatest paid trade from an indicative market feed. It should not be interpreted as an official closing price or official market statistics. -- SEK Daily change pending
Indicative intraday WAP iVolume-weighted average price calculated from Yahoo's 1-minute series during the day. It may differ from broker views and official daily statistics. -- SEK Difference versus live price
Intraday feed volume iAggregated intraday volume from an indicative 1-minute feed. Cross-check daily volume and turnover manually with Avanza and Nasdaq. -- Yahoo 1-minute series
Manual cross-check iUse external sources when exact daily volume, turnover, WAP and market-place statistics are required. Avanza ↗ Compare daily volume, turnover and WAP with the broker view.
Corrected information · 9 May 2026

The 2026 and 2029 financial targets have been withdrawn.

Subgen AI has corrected earlier company descriptions that incorrectly included revenue targets of EUR 28.5m for 2026 and EUR 64.3m for 2029. The company states that the figures were not approved by the Board and should not be regarded as guidance, forecasts or financial targets.

Status: correctedGrowth = user scenarioSource: Subgen AI / MFN

Group, reports and capital structure at a glance

Q1 2026, the 2025 annual report and the 9 May correction are now the main layer. The 1:6 offer remains history/capital structure, while the group, subsidiaries, corrected information and comparable reporting periods move up.

Reported now

Q1 2026 shows higher revenue, a larger asset base and continued negative EBITDA. The site now reads as a group terminal rather than a pure offer calculator.

Q1 revenue46,7 MSEKCurrent FX
Q1 constant FX53,7 MSEK+32% YoY
Q1 EBITDA-6,5 MSEKAdjusted: -5,7 MSEK
Substrate AI direct38,7% / 39,0%Capital / votes according to Q1
FY2025 baselineThe 2025 annual report shows 204.38 MSEK revenue, 82% gross margin and 37.7 MSEK adjusted EBITDA excluding RTO costs.
Capital structureThe 1:6 offer is completed and now sits as capital-structure history. Q1 states a direct holding in Substrate AI of about 38.7% of capital and 39.0% of votes, plus effective control through syndication agreements.
Link SecuritiesQ1 describes the right to receive 51% of Link Securities Capital S.L., subject to CNMV approval. It is a strategic financial-sector track with conditions still outstanding.
Reported: Q1 2026 / FY2025Model: SOTP stress testIndicative: live price / WAP / volume
Group map

Subgen / Substrate structure

Illustrative group overview. Use reports and official sources for verification.

Substrate AI group organisation chart
Q1 2026
46.7 MSEK revenue, 82.7% gross margin and 854.5 MSEK assets.
FY2025
204.38 MSEK revenue, 82% gross margin and 37.7 MSEK adjusted EBITDA excluding RTO costs.
Model discipline
Reported data, SOTP model and indicative live feed are kept as separate layers.
SUBGEN.ST
-- SEK
Indicative market feed for overview, chart and model reference.
WAP
-- SEK
Calculated from Yahoo’s 1-minute intraday series. Not official daily trading statistics.
Intraday feed volume iAggregated intraday volume from an indicative 1-minute feed. Cross-check daily volume and turnover manually with Avanza and Nasdaq.
--
Yahoo 1-minute series. May differ from official daily volume.
Market comparison
--
Live price relative to the 3 March reference 0.3140. Historical comparison, not the main case.

Source status for market data

What is indicative feed, what is checked manually and what is the official market reference.

Market data
Yahoo / Avanza / Nasdaq

Yahoo is used for live price, chart and intraday WAP. Daily volume and turnover are best checked against Avanza and Nasdaq.

Indicative feedYahoo 1mPrice, chart, intraday WAP and indicative intraday volume.
Cross-check manuallyAvanzaDaily volume, turnover and WAP can be checked manually.
Official market referenceNasdaq FNGMThe exchange overview is used as the official market reference.

Report toolbox

Four checkpoints that help the user read Subgen as a group after Q1.

Q1 reported

46.7 MSEK / 53.7 MSEK

Revenue at current FX and constant FX.

FY2025 base

204.38 MSEK

Revenue in the 2025 annual report.

Adjusted EBITDA

37.7 MSEK

FY2025 excluding non-recurring RTO costs.

SOTP model

445 / 585 / 725

Bear, base and bull as a user-controlled model.

Workspace

Facts first, SOTP as a user-controlled stress test and portfolio as optional local input.

Verified now
Q1 2026 published
Q1 shows 46.7 MSEK revenue at current FX, 53.7 MSEK at constant FX, 82.7% gross margin and 854.5 MSEK in total assets. At the same time, the focus shifts toward the group, subsidiaries and reported group content.
Reported
Latest update
Q1 2026 should now be the primary reported layer on the site. The 2025 annual report remains the comparative baseline, while the 1:6 offer moves down into a capital-structure layer rather than being the main story.
2026-05-09
Reported now
Q1 2026 · MSEK · SEK
Reported
Model layers
Current report state and event timeline
Market cap / gross SOTP / equity bridge
Acceptance after year-end
23.7% / 23.9%
Payment shares approved
291 284 082
Revenue
46.70 MSEK
Gross profit
38.60 MSEK
Gross margin
82.70 %
Adjusted EBITDA
-5.70 MSEK
EBITDA
-6.50 MSEK
Operating profit
-14 MSEK
Source status
Q1 2026 and the 2025 annual report are the verified source layers. SOTP and the EV-to-equity bridge are illustrative models. Live market data is used only when the feed passes freshness and validity checks.
Corrected information
On 9 May 2026 Subgen AI withdrew earlier revenue targets of EUR 28.5m for 2026 and EUR 64.3m for 2029. These figures should not be used as company guidance or forecasts.
What changed today?
The page now focuses on reported group data, subsidiaries, Link Securities, capital structure and user-controlled model analysis after Q1 2026.
Guidance / outlook
After the correction, no fixed company-approved revenue or EBITDA targets are inserted as fact. All forward growth inputs on Vinoxdata are user-controlled scenarios.
Calculator
SOTP, growth curves and the forensic bridge are model layers. They should not be interpreted as company guidance, but as tools where the user controls the assumptions.
Not confirmed yet
Future listings, Link Securities, subsidiary options and contingent risks must not be treated as realised value unless confirmed in official sources.
2026-03-31
Subgen AI Year-End Report 2025: Strong Serenity Star Performance
2026-04-02
1:6 offer result
2026-04-30
Annual report 2025 published
2026-05-07
Q1 2026 published

This block shows the active phase, latest verified update, upcoming dates and whether the page is in pre-event or live-event mode.

Methodology
Reported
Q1 2026 and FY2025 are the hard source layers.
Model
SOTP uses user-controlled gross scenario and complexity discount.
Indicative
Live data is an indicative terminal signal, not official trading statistics.
Historic
1:6 remains as a completed capital-structure event.
SOTP Stress Test

Illustrative valuation model · not an official valuation

The user chooses the scenario and discount. The model is not company fact; it shows how reported subsidiary data and assumptions may affect a possible per-share level.

SOTP
Method correction: Market capitalisation and the gross model are separate. Market cap = live price × share count. Gross SOTP should not be described as implied market value; it is a user-controlled model before debt, minority and risk adjustments.
Discount25 %
Gross SOTP585 MSEKBefore discount
Discount in MSEK−146 MSEKUser assumption
Net SOTP439 MSEKAfter discount
Value per share0,34 SEK1 309,7m
EV→equity bridge / forensic mode

Harder stress layer for debt, minorities, contingencies and dilution

This layer addresses the criticism of a pure gross model. All fields are user-controlled and are not company facts.

Forensic
After discount293 MSEKGross × (1-discount)
Adjustments deducted−279 MSEKDebt + risk + buffer
Equity value13 MSEKAfter deductions
SEK/share0.01 SEK1,309.7m

Initial values are hard stress assumptions, not verified net-debt measures. The purpose is to show the sensitivity from gross clusters to equity value, including a scenario where equity value can become very low or negative.

Zona Value + Kau + Link-option280 MSEKLargest balance-sheet and result cluster. Link remains conditional until approvals and completion are confirmed.
Cuarta Dimension / 4D / Diagximag205 MSEKThe healthcare path is clearer in the annual report, but remains a model cluster.
Delivery / consulting70 MSEKBinit, Deltanova, Subgen Spain, Fleebe, IFIT and related delivery businesses.
Agritech / vet10 MSEKBoalvet and Psvet as smaller legs.
Infra / USA / options20 MSEKStrategic optionality, valued cautiously.
Show older EBITDA/multiple model

EV

EBITDA × multiple

Price/share

Converted to SEK

Delta

Vs reference

Margin

Revenue / EBITDA
User portfolio
Empty by default · stored locally
Live valuationOrdinary shares, TO5 and TO6 are valued using the latest accepted indicative feed when available. If the feed is missing or too old, manual price / average cost is used as fallback.
SUBGEN
TO5
TO6
Status
Enter your own holdings
Enter the number of warrants, not deliverable shares.
Compare today’s ordinary share price with the post-recalculation strike price per share
Enter the number of warrants, not deliverable shares.
Compare today’s ordinary share price with the post-recalculation strike price per share

Invested

Shares + warrants

Current value

Shares at spot + warrants at indicative option price

TO5 market value

TO5 price × number of warrants

TO6 market value

TO6 price × number of warrants

TO5 – indicative price

Latest option price used per TO5

TO6 – indicative price

Latest option price used per TO6

Result

Distance to TO5 trigger

Positive number = remaining to the strike price per share
The portfolio is valued here using the latest indicative share price for the common stock and the latest indicative option price for TO5 and TO6. If an option quote is unavailable, acquisition cost is used as a fallback. The 1000 warrants = 1 share ratio affects delivery on exercise, while the trigger comparison is made against the post-recalculation strike price per share.
Reported timeline

Timeline after Q1

31 March 2026 Reported
Annual report 2025 published as FY baseline.
3 April 2026 Reported
Final 1:6 outcome: about 23.7% of capital and 23.9% of votes accepted; up to 291,284,082 consideration shares.
5 May 2026 Reported
Right to receive 51% of Link Securities Capital S.L. announced, subject to CNMV approval.
7 May 2026 Reported
Q1 2026 published with a new group and report focus.
9 May 2026 Corrected
Subgen withdrew earlier revenue targets for 2026 and 2029.
20 August 2026 Upcoming
H1 2026 becomes the next larger comparison point.

History is preserved, but the main focus is now comparable reporting periods and group development.

Group paths and 1:6 as history
Serenity Star
Agent platform, model management, AI governance and enterprise workflows.
Substrate Cloud
Sovereign AI cloud, compute and AI infrastructure.
4D Médica / Healthcare
Healthcare vertical with AI-assisted diagnostics and medical technology path.
Link Securities
New financial-services path, subject to CNMV approval.
1:6 history
Completed capital-structure event, no longer the main story.

The section is intentionally descriptive. It does not turn strategic options into verified valuation.

FAQ & methodology after Q1
Is the SOTP model verified fact?

No. SOTP is an analysis tool. Reported figures come from Q1/FY2025, but value clusters and discount are model assumptions.

Why keep live data?

Live price, WAP and volume keep the terminal useful in real time, but they are marked as indicative and do not replace official trading statistics.

Why use 1,309.7 million shares in SOTP?

It is a practical full capital base based on the annual-report owner table and subsequent consideration shares. The user can change the share count.

What does complexity discount mean?

The discount is the user’s own adjustment for holding structure, minorities, reporting quality, group complexity and still weak Q1 EBITDA.

Are my inputs stored?

SOTP sliders are not stored server-side. The portfolio tab uses local browser storage.

The FAQ tab explains assumptions, data sources and limitations. It does not replace reports or company market releases.

Frequently searched questions

Short, indexable answers to recurring questions about $SUBGEN, $SAI, TO5, TO6, dilution and official sources.

$SUBGEN · $SAI · TO5 · TO6
FAQ

What does Q1 2026 show for Subgen AI?

Q1 2026 shows 46.7 MSEK revenue at current FX, 53.7 MSEK at constant FX, 82.7% gross margin, EBITDA -6.5 MSEK and 854.5 MSEK in total assets.

Q1 2026, Subgen AI, revenue, EBITDA, assets
FAQ

What is the SOTP stress test on Vinoxdata?

The SOTP stress test is an illustrative valuation model where the user selects bear/base/bull and a complexity discount. It is not official company information and not investment advice.

SOTP, valuation model, complexity discount, Subgen AI
FAQ

What sits inside Subgen AI AB according to the report material?

The annual report describes a group built around Serenity Star, Substrate Cloud and 4DAI Core as platform layers, plus verticals and solutions such as Serenity Teams, Serenity Edge, Serenity AI Data Intelligence, Serenity LLMs and Substrate AI Healthcare. 4D Médica is highlighted as the healthcare subsidiary within the group.

Subgen group, Serenity Star, Substrate Cloud, 4D Medica
FAQ

How is the holding in Substrate AI described after Q1?

Q1 2026 states that Subgen AI directly holds about 38.7% of capital and 39.0% of votes in Substrate AI. The report also states effective control through existing syndication agreements.

Substrate AI, 38.7%, 39.0%, effective control
FAQ

How do TO5 and TO6 work in the calculator?

TO5 and TO6 should be handled with central ratio logic so that 1000 warrants correspond to one deliverable share. This keeps labels, language and calculations consistent across all three languages.

TO5, TO6, 1000 to 1, warrants
FAQ

Where can users find official sources for Subgen AI and Substrate AI?

Official sources should be prioritized over discussion forums. Examples include the companies’ investor pages, MFN, Nasdaq and BME Growth. Tools such as Investing and Börsdata can be used as complementary layers.

official sources, MFN, Nasdaq, BME, Investing
FAQ

What is the difference between an indicative feed and official statistics?

An indicative feed may be fast, but it is not always the legally or regulatorily final data point. The site should therefore clearly separate indicative market display from officially verified information.

indicative feed, official statistics, verified data
FAQ

Which dates matter most in the next event cycle?

For the central engine, 31 March 2026, 2 April 2026, 30 April 2026 and 7 May 2026 are separate event phases with their own content, sources and possible calculator changes.

31 March, 2 April, 30 April, 7 May, events
FAQ

What does Subgen’s correction of previous financial targets mean?

On 9 May 2026 Subgen AI stated that earlier revenue targets of EUR 28.5m for 2026 and EUR 64.3m for 2029 had been incorrectly included in company descriptions in three press releases. The company states that the figures were not approved by the Board and should not be regarded as guidance, forecasts or financial targets.

correction, financial targets, guidance, Subgen AI
FAQ

Are Vinoxdata growth scenarios company guidance?

No. After the correction, all forward growth numbers on Vinoxdata are treated as user-controlled scenarios. They are model assumptions and should not be read as official Subgen AI targets or forecasts.

growth scenario, model, guidance, SOTP
FAQ

What changed in Q1 2026 versus the annual report?

Q1 2026 adds a new reported layer with 46.7 MSEK revenue at current FX, 53.7 MSEK at constant FX, 82.7% gross margin and 854.5 MSEK in total assets. That makes group reporting and comparable periods more important than pure 1:6 logic.

Q1 2026, revenue, assets, report layer
FAQ

What can change on the site after the 2 April 2026 result?

Once the 1:6 result is verified, the site should be able to update acceptance level, new share count, dilution logic, summary text and relevant FAQs without changing the GUI.

2 April, outcome, acceptance level, new share count
FAQ

How is an implied value calculated in the 1:6 offer?

A common approach is to start with six Subgen shares multiplied by the current reference price and then translate that into a comparable value per Substrate share. The engine should keep this logic central and transparent.

implied offer value, 1:6, Subgen, Substrate
FAQ

Why is the 1:6 offer lower on the page?

After the completed outcome, 1:6 is mainly a capital-structure event. The main focus therefore moves to Q1 2026, the 2025 annual report, group structure and subsidiaries.

1:6, capital structure, Substrate AI, Subgen AI
FAQ

How many new Subgen shares can be issued at full acceptance?

The engine should support both a maximum scenario and a verified live outcome. The maximum scenario is useful before 2 April, while the verified outcome should be publishable immediately when confirmed.

full acceptance, new shares, dilution, max scenario
FAQ

What does the 1:6 offer mean for Substrate AI shareholders?

The base logic is that one Substrate share in the offer corresponds to six new Subgen AI shares. The public interpretation on the site should always be anchored in the official offer document and verified company announcements.

1:6 offer, Substrate AI, Subgen AI, exchange ratio

Sources and links

Links that help the user verify claims or continue to primary sources.

Filter
Forum links and weaker material are deliberately kept outside the main section.
Subgen AI – Investors
Official
Open
Official investor page with calendar, documents and IR navigation.
Subgen AI – correction of financial targets
Official
Open
Official 9 May 2026 correction withdrawing earlier revenue targets for 2026 and 2029; the figures should not be regarded as guidance, forecasts or corporate targets.
Subgen AI – Q1 2026 interim report
Official
Open
Official January–March 2026 interim report with Q1 figures, holdings and subsequent events.
Subgen AI – annual report 2025
Official
Open
Official 2025 annual report with FY2025 baseline, strategy, share data and reported subsidiaries.
Subgen AI – voluntary offer 2026
Official
Open
The company’s own landing page for the offer and related material.
Subgen AI – EU Growth Prospectus March 2026
Official
Open
Primary source for the 6:1 terms, maximum new shares and maximum dilution in the offer.
MFN – Subgen AI
Official
Open
Official company feed for press releases and regulatory updates.
Nasdaq – SUBGEN market overview
Context
Open
Official market page for SUBGEN. Nasdaq states that the web page shows delayed data and points to Trade Reports for post-trade data.
BME Growth – Substrate AI (SAI)
Context
Open
Official Spanish market page with company profile, documents and market information for Substrate AI.
Substrate AI – official website
Official
Open
The company’s own website for product, infrastructure and investor context.
Companies House – SUBGEN AI LIMITED
Official
Open
Official UK register source for filing history and dissolution status of SUBGEN AI LIMITED.
Investing – Subgen AI (SUBGEN)
Context
Open
Context source for price, charting and forum activity around $SUBGEN. The page still uses a legacy URL slug from the earlier company name and should not be treated as primary verification.
Investing – Substrate AI (SAI)
Context
Open
Context source for price history and forum activity around $SAI. Useful as a complement, not as primary verification.
Börsdata – Subgen AI
Context
Open
Complementary tool for Swedish key figures, history and multiples.
Data sources & signal discipline

Verified company facts and documents are shown separately from the indicative market feed. Live price, WAP, volume and chart are fetched via server cache and should be read as market signal, not official trading statistics.